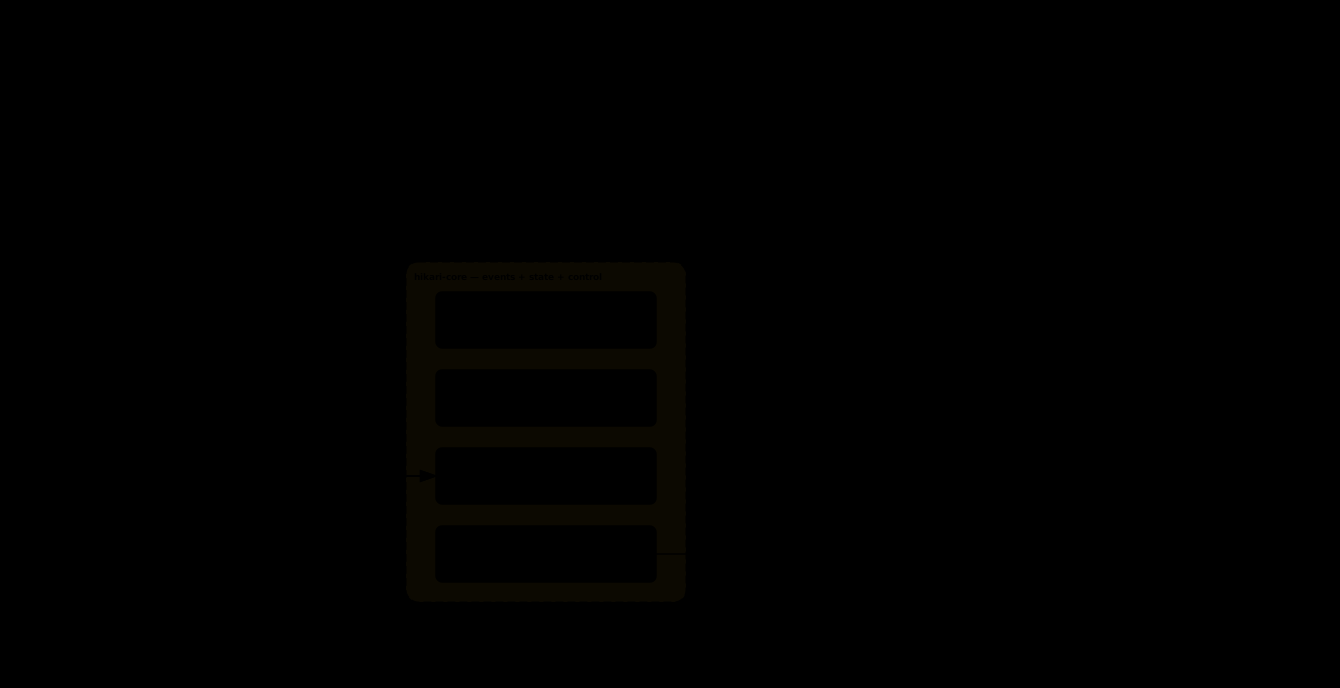
hikari-core
The durable event orchestration layer. It receives operator messages and device events, stores state, routes work to the right group, manages queues, and returns final analysis to the channel.

Hikari
AI agent for OTDR monitoring
Hikari connects three important pieces: hikari-core for durable event orchestration,
hikari-connect for ALM/OTDR device access, and an external LLM provider for reasoning.
Together they let an agent investigate alarms, compare traces, and return an
operator-ready analysis.
system
Hikari is built around clear operational boundaries. Device events and operator messages
are handled as durable work items, agent reasoning is delegated to an external provider,
and all ALM/OTDR interaction passes through hikari-connect.
The durable event orchestration layer. It receives operator messages and device events, stores state, routes work to the right group, manages queues, and returns final analysis to the channel.
The MCP bridge for ALM/OTDR devices. It exposes device operations as tools: ports, alarms, logbook, fingerprints, measurements, trace download, fault analysis, and generated diagrams.
The reasoning layer used by the agent runtime. Hikari keeps model reasoning separate from event storage and device access, so the provider can be hosted or local.
Per-group agent execution with isolated sessions, mounted context, logs, skills, and IPC. The runtime lets investigations run with a controlled operational scope.
Telegram and Slack carry operator requests and reports. SNMP traps enter as fiber monitoring events, so human requests and device alarms follow the same durable workflow.
Physical ADVA/ADTRAN ALM devices and demo/test simulators are accessed through hikari-connect. Authentication, sessions, device APIs, and command status stay behind the tool boundary.
runtime flow
An ALM trap becomes a durable incident workflow. hikari-core wakes the correct
group, the agent runtime uses an external LLM provider for reasoning, hikari-connect
queries the ALM/OTDR layer, and the result returns as structured incident evidence.

implementation model
Alarms and operator requests become durable messages before any agent work starts. That keeps investigations recoverable, traceable, and safe to retry.
The agent uses defined MCP tools to inspect ports, run measurements, compare traces, retrieve evidence, and build incident output.
hikari-core owns orchestration and delivery, hikari-connect owns ALM/OTDR access, and the LLM provider owns reasoning and report synthesis.
Groups run with their own sessions, context, logs, and tool scope so production monitoring, demos, and tests do not blend state.
The simulator can create realistic device states and fault scenarios so the same workflow can be demonstrated and tested without physical hardware.
demo and testing
Hikari includes an ALM/OTDR simulator for demos, integration testing, and repeatable development when physical devices are not available. It can emulate ports, monitoring cycles, OTDR traces, alarm transitions, and fault scenarios so the same core/connect/LLM workflow can be exercised end to end.

example output
This example shows the kind of data the Hikari agent can provide during a fiber incident: route context, fault classification, OTDR trace comparison, likely fault location, signal-loss evidence, and dispatch-ready conclusions.
Open full sample report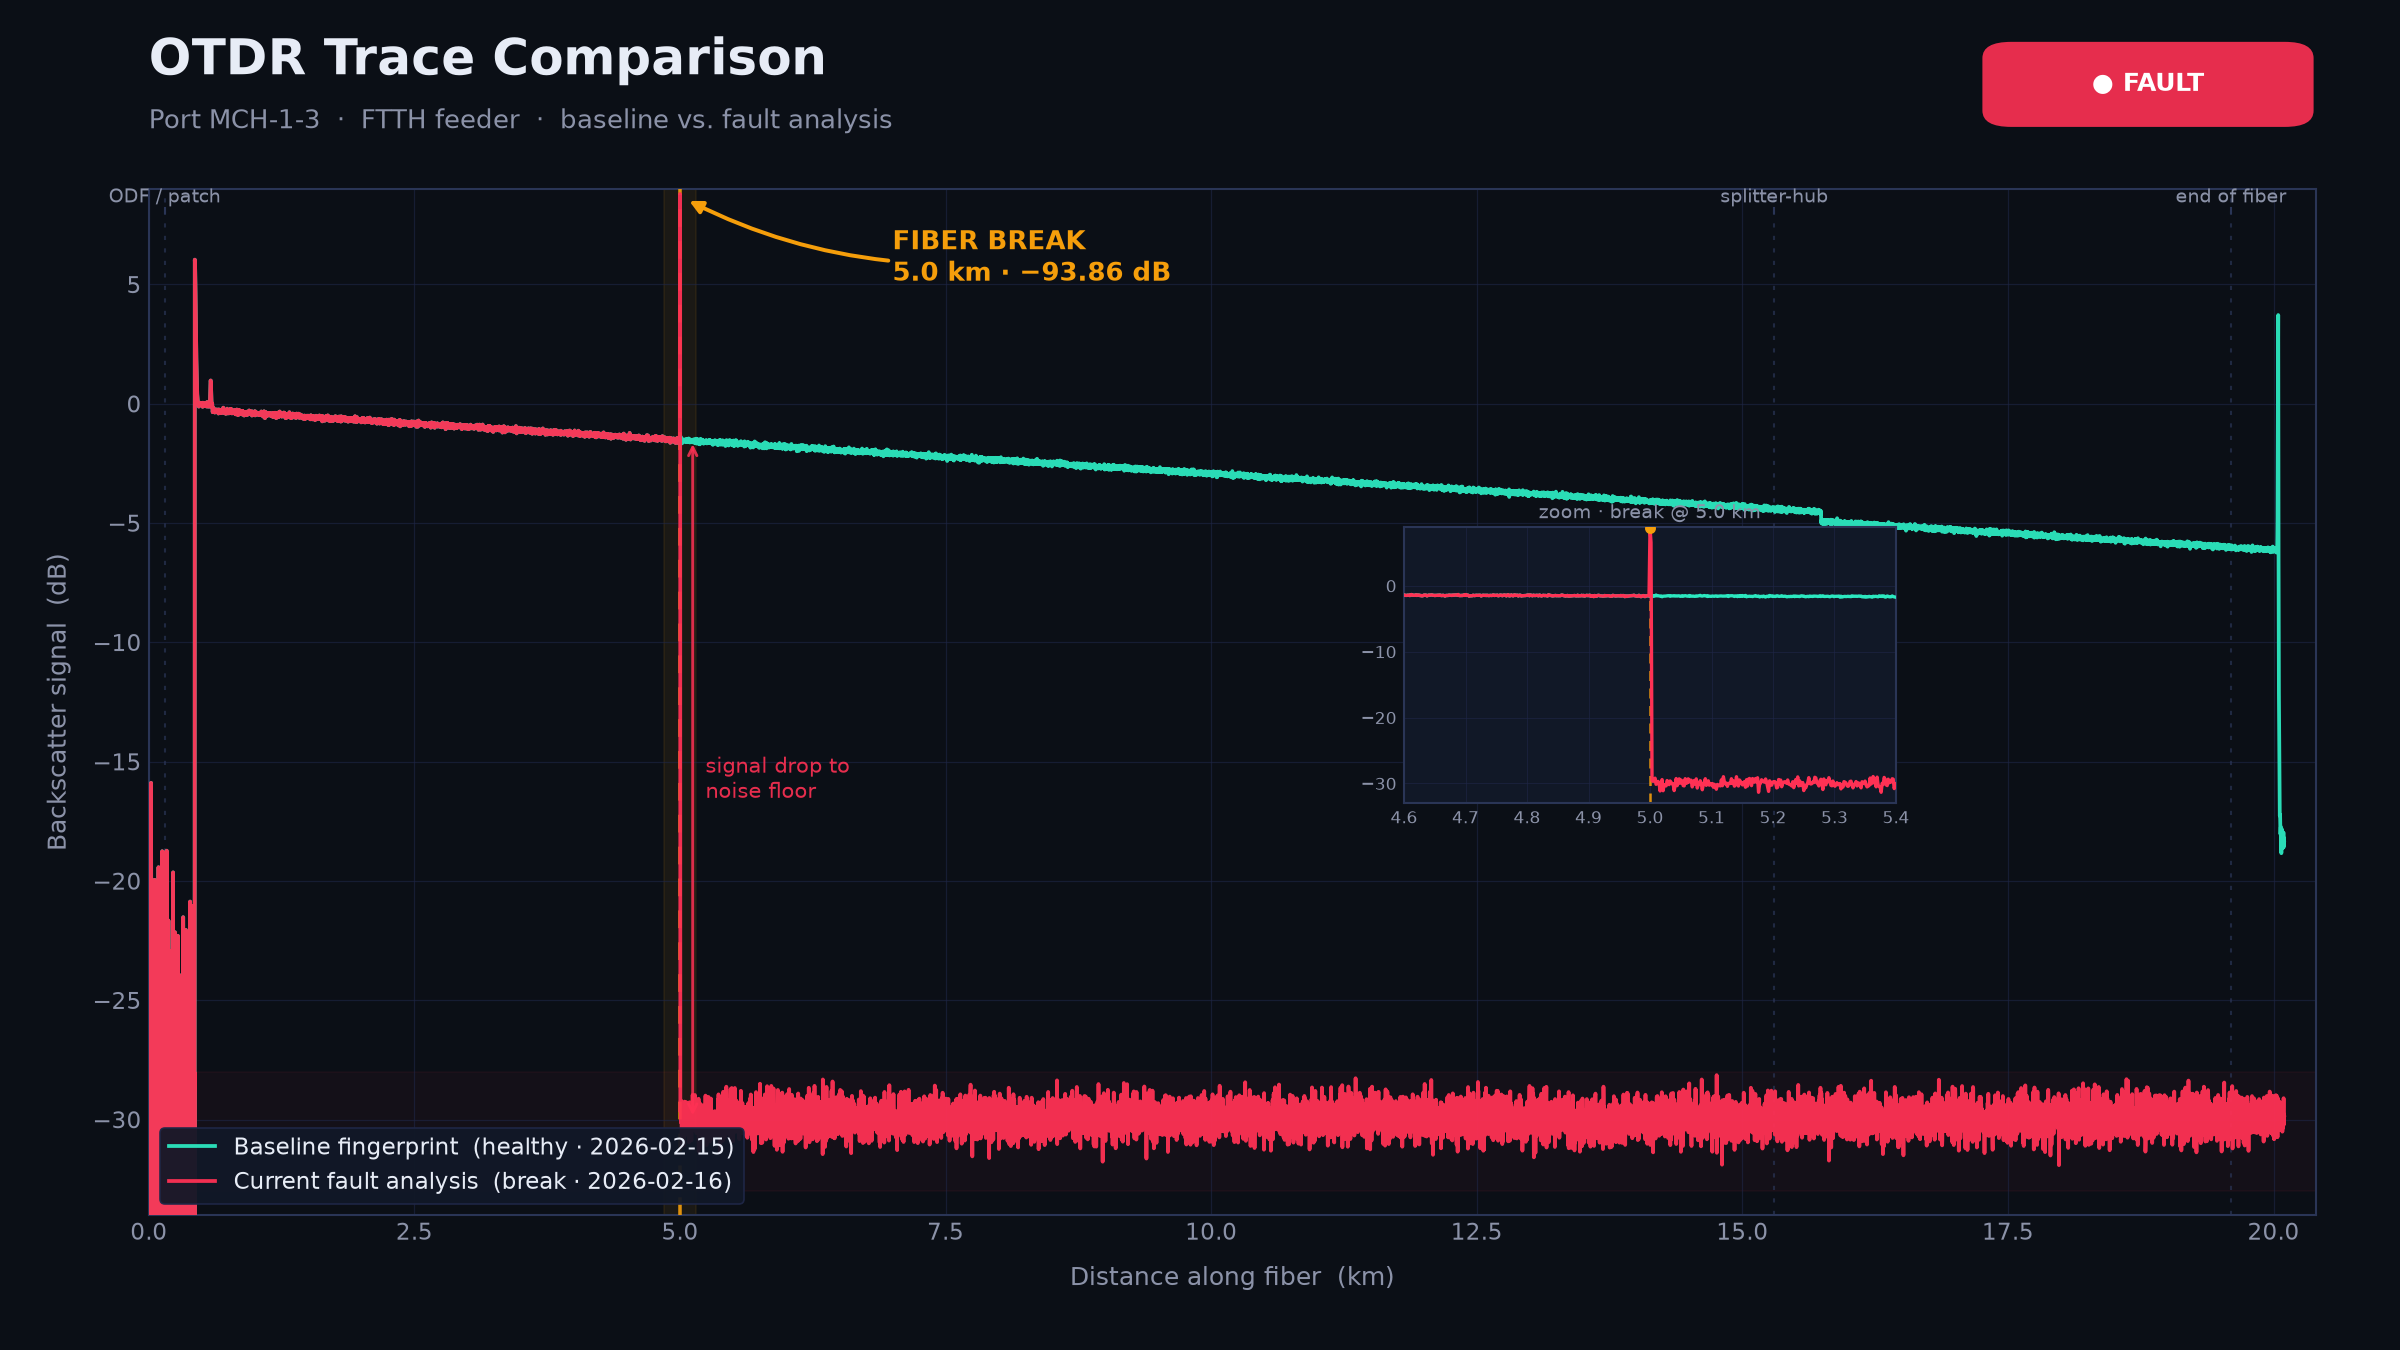
The comparison overlays a healthy baseline trace with the fault-analysis trace. The current trace follows the baseline until the 5.0 km failure point, then drops to the noise floor. The baseline continues toward the known end-of-fiber event at 19.6 km, making the break location and service impact visible at a glance.